
Fortsetzung
Um das Ganze zu verdeutlichen: Zum Anfang des Videos sind, genau wie im ersten, vorherigen Teil, die 3 Aufnahmen zu sehen, die mit der Sicherheitskamera im Haus gemacht wurden. Direkt im Anschluss hört man die Original-Aufnahmen vom Rekorder, synchron unterlegt mit den dazugehörigen Spektrogrammen und Wellenformen.
Da zum Zeitpunkt der Vorfälle noch weitere Geräte im Haus verteilt waren, gibt es hier noch eine Menge Arbeit. Da dieses zusätzliche Audiomaterial noch auszuwerten ist, dauert es natürlich noch etwas, bis alles vollständig und lückenlos ausgewertet ist. Zusätzlich liegen weitere Aufnahmen von anderen Untersuchungen hier im Haus auf dem Tisch, deren Material ebenfalls noch gesichtet werden muss. Wir halten Euch auf dem Laufenden.
SPEKTOGRAMM 1 (Der erste von drei Schlägen)
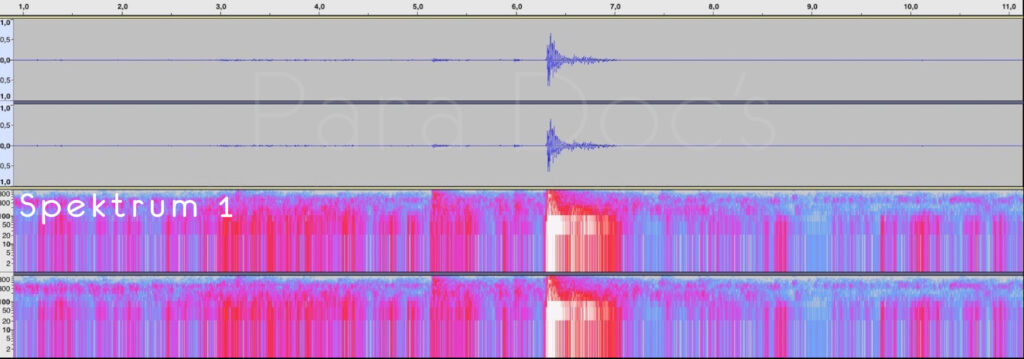
Das Bild zeigt oben zwei Wellenform-Kanäle und unten die beiden dazugehörigen Spektrogramme. Genau an der Marke von ca. 6,3 Sekunden bricht die Energiewelle los.
In der Wellenform (oben): Ein schlagartiger, extrem steiler Ausschlag (Peak), der fast bis auf die +0,5/-0,5er-Linie hochjagt und danach in einer sauberen, physikalischen Welle abklingt.
Im Spektrogramm (unten): Exakt bei Sekunde 6,3 schießt dieser breite, strahlend weiße Balken wie eine Wand von ganz unten bis ganz nach oben durch alle Frequenzen. Das ist die Wucht des ersten Einschlags, die an dieser Stelle die Farbskala komplett ins Weiße „übersteuert“! Erst danach wechselt das Signal in die rötlichen und bläulichen Töne.
SPEKTOGRAMM 2 (Rund 30 Minuten später)
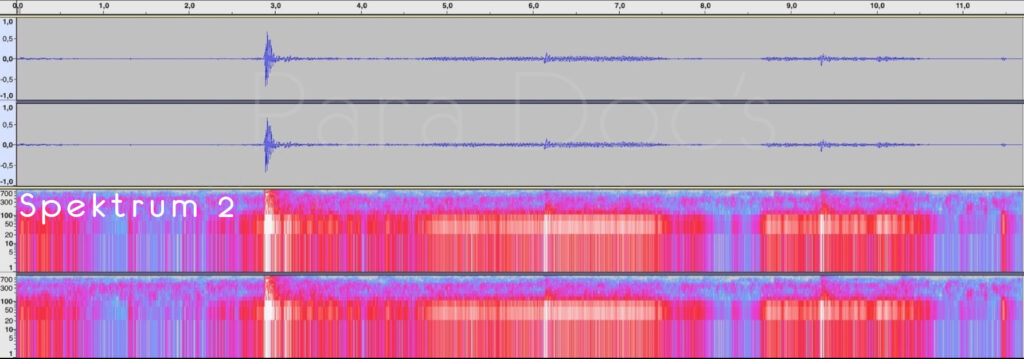
Der Impuls bricht hier bei ca. 3,0 Sekunden auf der Zeitachse.
Die Farbintensität verändert sich: Der weiße Balken im Spektrogramm ist immer noch massiv, aber er wirkt ein ganz kleines bisschen schmaler als beim ersten, brutalen Knall. Der erste Schlag hatte die absolut maximale, härteste Energiekonzentration. Dieser zweite Schlag, rund 30 Minuten später, war zwar immer noch ein gewaltiges „Rumsen“ mit hohem Schalldruck, aber die Frequenzanteile verteilen sich farblich schon minimal anders.
SPEKTOGRAMM 3 (Der finale Impuls)
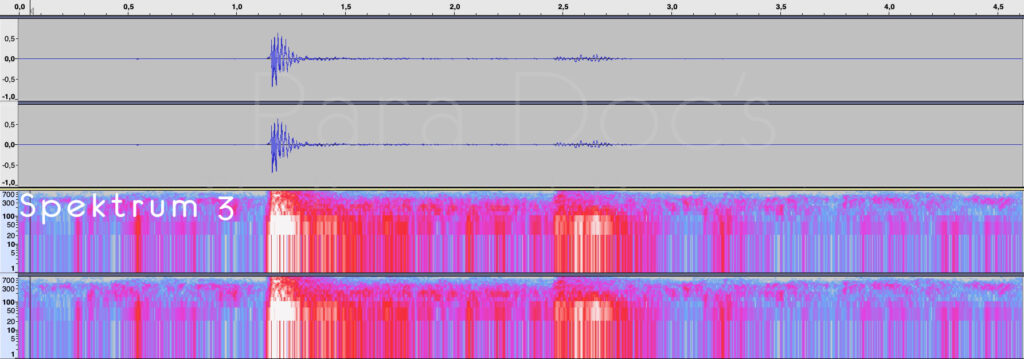
Dieses dritte Bild zeigt den finalen Impuls dieser Phase im Haus. Wenn man die drei Grafiken nacheinander betrachtet, wird die physikalische Entwicklung klar:
Der Peak auf der Zeitachse: Bei diesem dritten Schlag bricht die Amplituden-Nadel ganz vorne aus, bei ca. 1,2 Sekunden auf der Zeitachse jagt der Impuls schlagartig hoch.
Die Energieverteilung: Im Spektrogramm unten sieht man wieder den weißen Balken, der die Skala übersteuert. Wenn man aber ganz genau hinschaut, sieht man, dass er im Vergleich zum allerersten Impuls etwas schmaler geworden ist. Die Energie flacht zum Ende der Phase hin ab. Das System hat sich danach entladen und die Ruhe kehrte ins Haus zurück. Solch einen Impuls gab an diesem Tag nicht noch einmal.
DATA ANALYSIS / MEASUREMENT EVALUATION
To clarify the context: At the beginning of the video, just like in the first, previous part, you can see the 3 recordings that were captured by the security camera inside the house. Directly after that, you can hear the original recordings from the audio recorder, synchronously backed by the corresponding spectrograms and waveforms.
Since there were several other devices distributed throughout the house at the time of these incidents, a significant amount of work remains. Because this additional audio material still needs to be analyzed, it will of course take some time before everything is completely and seamlessly evaluated. Additionally, further recordings from other investigations here in the house are on the table, and their material must be reviewed as well. We will keep you updated.
SPECTROGRAM 1 (The first of three impacts)
The image shows two waveform channels at the top and the two corresponding spectrograms at the bottom. Exactly at the mark of approx. 6.3 seconds, the energy wave breaks loose.
In the waveform (top): A sudden, extremely steep deflection (peak) that shoots up almost to the +0.5/-0.5 line and then decays in a clean, physical wave.
In the spectrogram (bottom): Exactly at second 6.3, this broad, brilliant white bar shoots like a wall from the very bottom to the very top through all frequencies. This is the sheer force of the first impact, which completely clips the color scale into white at this point! Only after that does the signal shift into reddish and bluish tones.
SPECTROGRAM 2 (Approx. 30 minutes later)
The color intensity changes: The white bar in the spectrogram is still massive, but it appears a tiny bit narrower than during the first, brutal crash. The first impact had the absolute maximum, hardest concentration of energy. This second impact, around 30 minutes later, was still a powerful thud with high sound pressure, but the frequency components are already distributed slightly differently in color.
SPECTROGRAM 3 (The final impulse)
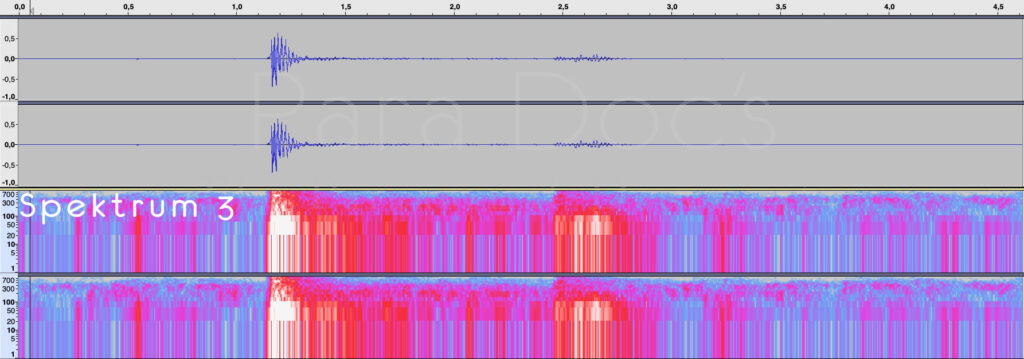
This third image shows the final impulse of this phase in the house. When looking at the three graphics one after the other, the physical development becomes clear:
The peak on the timeline: In this third impact, the amplitude needle breaks out right at the front—at approx. 1.2 seconds on the timeline, the impulse spikes suddenly.
The energy distribution: In the spectrogram below, you can see the white bar clipping the scale once again. However, if you look very closely, you can see that it has become somewhat narrower compared to the very first impulse. The energy flattens out towards the end of the phase. The system discharged after that, and quiet returned to the house. An impulse of this magnitude did not occur again that day.